Left wingers have an awfully perverse way of helping workers. Their primary means of doing so is to call for higher minimum wages and more labor unions.
The raising the minimum wage is a proven way to kill jobs since workers who don't produce revenues equal or greater than the minimum wage become costs to their employers. In fact, 85% of the most credible studies on minimum wage laws find that they create unemployment among low skilled workers [1].
Unions on the other hand are labor cartels which the number of workers in a company in order to boost the remaining workers wages, a scheme which is great for unionized workers but detrimental to non-unionized workers and the economy as a whole.
According to economists Richard K. Vedder and Lowell E. Gallaway, unions have cost the US economy $50 trillion between 1947 and 2000 [2]. Unions have been found to increase unemployment and lower investment, in fact, unionized industries tend to grow the slowest [3].
All that left wingers have to offer workers is benefits for some at the expense of others. Free market policies on the other hand attempt to raise worker's wages (at no one else's expense) by increasing their productivity (since wages are a function of productivity [4]).
According to the Free Marteteer, taxes which reduce the incentive to work or invest in capital will harm worker productivity growth and thus slow the growth of worker's wages. In fact, the marketeer acknowledges that restraining government spending, increasing economic freedom, and pro-growth tax reform are the best ways to boost workers wages. Consider the the following:
- Empirical research on the size of government consistently finds that government spending is significantly negatively correlated with economic growth (even when controlling for numerous other confounding variables) [5].
- "If government expenditures as a share of GDP in the United States had remained at their 1960 level, real GDP in 1996 would have been $9.16 trillion instead of $7.64 trillion, and the average income for a family of four would have been $23,440 higher." [6]
- "[T]he average income of the poorest 10% [of income earners in the most economically free countries] was $10,556, compared
to $932 [for the poorest 10% of income earners in the least economically free countries] in 2011US (PPP) dollars" [7]
- Abolishing the current federal tax system and replacing it with a progressive sales tax would increase worker's real (inflation adjusted) wages by around 10% and increase employment between 5-10% over the current system according to several studies. [8]
- Abolishing the corporate income tax would raise worker's wages by 12-13% thanks to increased investment in capital and correspondingly higher worker productivity according to a recent study [9].
Ultimately, the free marketer is the realist who acknowledges that wages cannot simply be raised according to the will of politicians. Rather, raising worker's wages is best done by instituting pro-growth policies which encourage work, investment, and growing worker productivity. Lastly, unlike the policies of the left winger, those advocated by the marketeer raise wages at no one's else's expense. As Milton Friedman once noted:
“When unions get higher wages for their members by restricting entry into an occupation, those higher wages are at the expense of other workers who find their opportunities reduced. When government pays its employees higher wages, those higher wages are at the expense of the taxpayer. But when workers get higher wages and better working conditions through the free market, when they get raises by firm competing with one another for the best workers, by workers competing with one another for the best jobs, those higher wages are at nobody's expense. They can only come from higher productivity, greater capital investment, more widely diffused skills. The whole pie is bigger - there's more for the worker, but there's also more for the employer, the investor, the consumer, and even the tax collector.
That's the way the free market system distributes the fruits of economic progress among all people. That's the secret of the enormous improvements in the conditions of the working person over the past two centuries.”
Citations:
[1] http://www.socsci.uci.edu/~dneumark/min_wage_review.pdf
[2] http://www.ncpa.org/sub/dpd/index.php?Article_ID=5589
[3] http://www.heritage.org/research/reports/2009/05/what-unions-do-how-labor-unions-affect-jobs-and-the-economy
[4] http://www.sparknotes.com/economics/micro/labormarkets/labordemand/section1.rhtml
[5] http://www.ifn.se/wfiles/wp/wp858.pdf
[6] http://frihetspartiet.net/function.pdf
[7] http://www.freetheworld.com/2013/EFW2013-complete.pdf
[8] http://being-classical-liberal.blogspot.com/2014/03/its-no-secret-that-our-current-federal.html
[9] http://www.kotlikoff.net/sites/default/files/Corporate%20Income%20Tax%20NBER%20WP%2019757.pdf

Being Classically Liberal
Tuesday, April 29, 2014
Friday, April 25, 2014
The Optimal Size of Government
I generally analyze how government actions affect economic growth. In this post I will go through some of the empirical evidence on the optimal size of government. In the following studies, the optimal size of government is measured by government spending (as a % of GDP) which maximizes economic growth.
First it's worth noting that the majority of the empirical literature on the relationship between government size and growth finds that government spending is contractionary (meaning it decreases economic growth). Consider a recent survey of the literature which states:
"The most recent studies [on the relationship between government size and growth] find a significant negative correlation: An increase in government size by 10 percentage points is associated with a 0.5 to 1 percent lower annual growth rate." [1]
Keep in mind the studies surveyed controlled for many others variables such as population, lagged per capita GDP, net debt to GDP ratios, institutional factors, economic freedom, regional variations, etc in order to isolate the affect government spending has on economic growth.
Using evidence provided by studies like the one previously mentioned, researchers have been able to predict the optimal (growth maximizing) size of government. For example:
Chobanov and Mladenova (2009) finds:
"The evidence indicates that the optimum size of government, e.g. the share of overall government spending that maximizes economic growth, is no greater than 25% of GDP (at a 95% confidence level) based on data from the OECD countries." [2]
Di Matteo of the Fraser Institute concludes:
"All other things given, annual per capita GDP growth is maximized at 3.1 percent at a government expenditure to GDP ratio of 26 percent (of GDP); beyond this ratio, economic growth rates decline." [3]
Our friends over at Unbiased America have provided more studies:
16% +/- 3% of GDP.
Karras, G. (1997). “On the Optimal Government Size in Europe: Theory and Empirical Evidence,” The Manchester School of Economic & Social Studies
Karras, G. (1997). “On the Optimal Government Size in Europe: Theory and Empirical Evidence,” The Manchester School of Economic & Social Studies
17.3% +/- 3% of GDP.
Gunalp, B. and Dincer, O. (2005). “The Optimal Government Size in Transition Countries,” Department of Economics, Hacettepe University Beytepe, Ankara and Department of Commerce, Massey University, Auckland
Gunalp, B. and Dincer, O. (2005). “The Optimal Government Size in Transition Countries,” Department of Economics, Hacettepe University Beytepe, Ankara and Department of Commerce, Massey University, Auckland
17% to 20% of GNP.
Peden, E. (1991). “Productivity in the United States and its relationship to government activity: An analysis of 57 years, 1929-1986,”
Peden, E. (1991). “Productivity in the United States and its relationship to government activity: An analysis of 57 years, 1929-1986,”
The average rate of federal, state and local taxes combined should be between 21.5 and 22.9% of GNP.
Scully, G. (1994). “What is the optimal size of government in the US?,” National Center for Policy Analysis, Policy Report No. 188
Scully, G. (1994). “What is the optimal size of government in the US?,” National Center for Policy Analysis, Policy Report No. 188
28.9% of GDP
Vedder, R. and Gallaway, L. (1998). “Government Size and Economic Growth,” Joint Economic Committee, Washington D.C., p. 5
Vedder, R. and Gallaway, L. (1998). “Government Size and Economic Growth,” Joint Economic Committee, Washington D.C., p. 5
14.7% of GDP
Davies, A. (2008). “Human Development and the Optimal Size of Government,” Journal of Socioeconomics, forthcoming
Davies, A. (2008). “Human Development and the Optimal Size of Government,” Journal of Socioeconomics, forthcoming
NOTE: There are even more studies than these, the highest estimates I've seen is 37% for European Countries. Almost all studies purport that the optimal size of government is 30% or less, with the majority finding it to be between 15-25%.
Citations:
Friday, April 18, 2014
Corporate taxation and economic growth aren't friends.
This post is dedicated to all the people who know nothing about economics and want the government to force corporations to "pay their fair share".
The corporate tax is probably the most harmful tax on economic growth since it discourages investment and thus productivity growth (as well as encouraging hiding income over seas).
Take for example, a series of OECD papers by Johansson et al. that examined 21 OECD (rich) countries between 1971 and 2004 that found corporate taxes were the most harmful to economic growth, followed by income taxes, then consumption taxes, and lastly property taxes. According to the a summary of the study:
"[A] 1 percent shift of tax revenues from income taxes (both personal and corporate) to consumption and property taxes would increase GDP per capita by between 0.25 percent and 1 percent in the long run." [1]
Not only that, but corporate taxes end up hurting workers slow growth in investment results in slower productivity growth, and thus slow growth in wages (since wages are based on worker productivity). In a recent working paper published by the National Bureau for Economic Research, economist Laurence Kotlifoff estimates that abolishing the corporate tax and replacing the lost revenue with higher income or consumption taxes would increase workers wages in the long run by 12-13%. [2]
Here is some more research on corporate taxes:
-Mertens and Ravn examine corporate taxes after WWII in the US and find that "A 1 percentage point cut in the ACITR [average corporate income tax rate]raises real GDP per capita on impact by 0.4 percent and by 0.6 percent after one year." Additionally, they find that a 1 percentage point cut in the APITR [average personal income tax rate] raises real GDP per capita by 1.4 percent on impact and by up to 1.8 percent after three quarters." [3]
-Ferede and Dahlby examine corporate taxes and their effect on economic growth in the Canadian provinces and conclude by stating: "Our empirical analysis suggests that 1 percentage point cut in the corporate tax rate is related to a 0.1-0.2 percentage point increase in the annual growth rate." [4]
-Economists Young Lee and Roger Gordon examine corporate taxes in 70 countries over 20 years and state: "This paper finds that the corporate tax rate is significantly negatively correlated with economic growth in a cross-section data set of 70 countries during 1970-1997, controlling for many other determinants of economic growth." [5]
-Another study from Johansson et al. found that: "Corporate income taxes can be expected to be the most harmful for growth as they discourage the activities of firms that are most important for growth: investment in capital and in productivity improvements." [6]
-Kevin Hasset and Aparna Mathur of the American Enterprise Institute examined 72 countries over 22 years and found that on average, a 1% increase in the corporate-tax rate is associated with a 0.8% drop in wages over the next five years after controlling for other relevant macroeconomic factors. [7]
These are just some studies which examine how corporate taxes effect wages and economic growth. I think it's safe to safe that the majority of studies find that corporate taxes are harmful to economic growth, with a minority finding is has no effect. Regardless, this research exemplifies how foolish it can be to simply make assumptions that the government can raise taxes on corporations with no adverse consequences.
Citations:
[1] http://www.oecd.org/tax/tax-policy/41000592.pdf
[2] http://www.nber.org/data-appendix/w19757/CorporateTaxPaper.pdf
[3] http://pubs.aeaweb.org/doi/pdfplus/10.1257/aer.103.4.1212
[4] http://ntj.tax.org/wwtax/ntjrec.nsf/175d710dffc186a385256a31007cb40f/d2eeb9d5f1d7f7ea85257a6f00551c60/$FILE/A03_Ferede.pdf
[5] http://www.washingtonpost.com/blogs/wonkblog/wp/2013/06/05/corporate-taxes-dont-cause-recessions-but-they-do-hurt-growth/
[6] https://www.kent.ac.uk/economics/documents/research/papers/2009/0925.pdf
[7] http://www.aei.org/papers/economics/fiscal-policy/taxes-and-wages-paper/
Monday, April 14, 2014
Sunday, April 13, 2014
Myth: Gun control in Australia reduced gun homicides and suicides tremendously.
Myth: Gun control in Australia reduced gun homicides and suicides tremendously.
-Australian gun control and Mass Shootings
In 1996, the Australian government instituted strict gun control measures which made it almost impossible for a civilian to own a semi-automatic rifle or shotgun after a mass shooting which left 35 people dead (the even restricted access to airsoft guns). Since then, Australia hasn't witnessed a mass shooting, leading many gun control advocates crediting the 1996 gun control legislation as the cause of the lack of mass shootings. Are they right? No.
A 2011 study published by the Justice Policy Journal examined the incidence of mass shootings in Australia and New Zealand over a 30 year time period. The results don't provide any evidence in favor of the belief that banning guns reduces mass shootings. According to the authors:
"[The results do]not find support for the hypothesis that Australia’s prohibition of certain types of firearms has prevented mass shootings, with New Zealand not experiencing a mass shooting since 1997 despite the availability in that country of firearms banned in Australia." [1]
- Gun control and firearm homicide and suicide
After the 1996 gun control legislation, firearm homicide declined, leading gun control advocates to credit gun control as the cause of this decline. However, firearm homicides were already declining before the gun control legislation passed. A study published by the University of Melbourne studied the effects of the 1996 gun control legislation on firearms homicide and suicide. The authors report:
"The results of these tests suggest that the NFA [the gun control legislation] did not have any large effects on reducing firearm homicide or suicide rates." [2]
Additionally, a study published in the British Journal of Criminology found that there was no evidence that the NFA [National Firearms Agreement] had any impact on reducing firearm homicide [3]. They did find that it may have helped reduce firearm suicide, but they that societal factors were already reducing suicide rates.
Lastly, a 2009 study the Australian Institute for Suicide research studied how the NFA effected suicide rates and found the following:
"The implemented restrictions may not be responsible for the observed reductions in firearms suicide. Data suggest that a change in social and cultural attitudes could have contributed to the shift in method preference". [4]
So now you have the facts. Do with them as you will.
Citations:
[1] http://papers.ssrn.com/sol3/papers.cfm?abstract_id=2122854
[2] http://www.melbourneinstitute.com/miaesr/publications/working-paper-series/abstract-178.html
[3] http://bjc.oxfordjournals.org/content/47/3/455.abstract
[4] http://www.biomedexperts.com/Abstract.bme/18839044/Controlling_firearms_use_in_Australia_has_the_1996_gun_law_reform_produced_the_decrease_in_rates_of_suicide_with_this_method
Saturday, April 12, 2014
Myth: 90% taxes had no effect on growth in the 1950's
Proponents of high taxes on the wealthy argue that
the government used to force the wealthy to pay 90% of their income in taxes
and the economy did great. This isn’t exactly true. Here are some reasons why:
-Only a small portion of wealthy people’s income was
subject to the 90% tax rate.
Since the US has a progressive income tax, the 90%
rate only applied to a person’s income after they reached a certain income
level. As you can see in the chart on the left, the top marginal tax rate was
over 90% throughout the 40’s and 50’s until 1964, when it was lowered to 77%
[1]. However, top tax rates are applicable to different income levels over
time. The 90% top tax rate applied to every dollar earned after someone earn
$2.3 million during the 40’s and 50’s (in 2011 dollars). In contrast, today’s
top tax rate is 40% in applies to every dollar earned after a person earns
$388,000 (in 2011 dollars) [1]. It’s also worth noting that the poorest income
earners faced income tax rates of 20% in the 40’s and 50’s vs. 10% today [1].
In the end, the 90% tax rate applied to a very small percentage of income to a
very small percentage of people.
-During the 40’s and 50’s, rich people didn’t pay
the 90% rate.
The statutory tax rate is the legally imposed tax
rate. However, most people don’t pay taxes at this rate due to the numerous tax
deductions, credits, etc which they use
to reduce their tax liability. Thanks to all these “loopholes” the rich paid a
fraction of what the government wanted. The graph on the left compares the top
statutory rate to the top effective rate, which is the rate that people
actually paid once they hit the top tax bracket. As you can see, top effective
rates have remained steady around 25% throughout the 20th century
[2]. The graph on the top right also shows that federal income taxes as a % of
the economy have remained relatively constant throughout the 20th
century as well. The middle graph on the right shows that federal revenues as a
% of the economy have been steady over US history [3], while the graph on the
bottom shows that US federal government spending as a % of the economy has
followed a similar trend [4]. (However, total government spending as a % of the
economy has risen steadily over time).

Historically, it appears as though the high
statutory tax rates have had no effect on government revenues. Then again, we
wouldn’t expect them to for the reasons given above. One thing that is worth
noting is that in the early 1980’s, the federal government under Ronald Reagan
cut top taxes rates dramatically from 70% to 50% in 1982, then from 50% to 39%
in 1987, and from that to 28% in 1988 [1]. Although leftists may attack this as
“trickle-down economics”, it should be noted that Reagan cut taxes for everyone
and more importantly that the top effective tax rate under Reagan wasn’t
significantly different from the top effective tax rates in the 40’s and 50’s,
when statutory rates were above 90% [2]. This is because Reagan closed tax
loopholes and cut taxes. Reagan’s tax cuts weren’t a giveaway, they were meant
to make the tax code more efficient and transparent. According to one person
over at EconomicPolicyJournal.com:
“The
dishonesty or perhaps ignorance in the tax debate that is going on today is the
complete misrepresentation of the pre-TRA86 [Tax Reform Act of 1986] higher
marginal rates in the old ’53 code. Sure the marginal rates were insane, but
the underlying tax code was rife with loopholes that a good tax planner (I was
one) could exploit to get a person’s effective tax rate as low or lower then it
is today. Those loopholes are no longer part of the tax code which is a good
thing as they encouraged investors to invest in projects that had no economic
viability other then the income sheltering effect they created” [5]
-Empirical evidence finds that taxes are incredibly
detrimental to growth.
Christina Romer, a leading Keynesian economist behind the 2009 stimulus package, authored an empirical study with her husband titled, “The Macroeconomic Effects of Tax Changes: Estimates Based on a New Measure of Fiscal Shocks”. In the study, the Romers examine the economic history of the United States and study how changes in tax revenue as a percent of the economy affect economic growth. Their findings are unsurprising to supply side economists, but utterly destructive to the arguments for higher made by those on the left. According to the Romers:
Citations:
[1] http://en.wikipedia.org/wiki/Income_tax_in_the_United_States#History_of_top_rates[2] http://blackburn.house.gov/uploadedfiles/jec_republican_staff_analysis_historical_tax_rates_rhetoric_vs_reality.pdf.pdf[3] http://www.usgovernmentrevenue.com/revenue_history[4] http://www.usgovernmentspending.com/past_spending[5] http://tomwoods.com/blog/didnt-we-used-to-have-high-taxes-and-prosperity/[6] http://www.nber.org/papers/w13264.pdf?new_window=1[7] http://taxfoundation.org/article/what-evidence-taxes-and-growth
Thursday, April 10, 2014
Myth: Rifles like the AR-15 are extremely dangerous.
Rifles are no more dangerous than hands or feet.
In 2009, there were only 313 unjustifiable homicides committed with any type of rifle [1]. This is out of 110 million rifles in the United States at the time. [2] This implies that of all the rifles in the United States in 2009, 0.00028% were used to commit murders. This means that the homicide rate per 100,000 rifles is 0.28.
That same year, there were 810 unjustifiable homicides committed with hands or feet [1]. The population that year was 305 million, which implies that of the number of pairs of hands and feet in the US (the population), 0.00027% were used to commit murders. This means that the homicide rate per 100,000 pairs of hands/feet is 0.27.
So in 2009, not only were hands and feet used more often to murder people than rifles were (810 vs. 313), but the homicide rate per 100,000 rifles is nearly exactly the same as the homicide rate per 100,000 pairs of hands/feet (0.28 vs 0.27).
These findings indicate that in terms of statistics, rifles are no more deadly than a pair of hands and feet.
Citations:
[1] https://www2.fbi.gov/ucr/
--See data tables 14 and 15 for justifiable homicide data
[2] http://www.gunpolicy.org/
Wednesday, April 9, 2014
4 Surprising facts about gun violence.
4 Surprising facts about gun violence.
1.
The scariest guns kill the least amount of people.
Despite the extensive coverage dedicated to “assault
weapons” by the media following mass shootings, it appears as though such
coverage excludes a few important details. For one, “assault weapons” are
functionally no different from any other firearm. As one study has noted of the
1994-2004 “assault weapons” ban:
"The AW [assault weapon]
provision [of the ban] targets a relatively small number of weapons based on
features that have little to do with the weapons operation, and removing those features is sufficient to make the
weapons legal."
That’s right, the difference
between an assault weapon and any other firearm are purely superficial, one is
far more disturbing than the other, but they are both the same on the inside.
Despite the media craze about the
danger of “assault weapons” like the AR-15, FBI data shows that ALL rifles were only confirmed to have
been used in 322 homicides in 2012. And
when justifiable homicides committed in self-defense are excluded, the number
is a mere 266. This is in comparison to 1,554 unjustifiable homicides
committed with knives, 518 committed with blunt objects, and 667 committed with
hands or feet. Thus, a US citizen’s
chance of being murdered by a person with a rifle was 0.000085% in 2012.
According to the US Congressional Research Office, there were approximately 110 million rifles in the United States in 2009. Assuming that number stayed the same (it probably grew) in 2012, that implies that 0.00024% of rifles are involved in unjustifiable homicides. In comparison, of the 312 million pairs of hands and feet in the United States, 667 were used in homicides. That implies that 0.00021% of pairs of hands/feet were used in unjustifiable homicides, a percentage insignificantly different from percent of rifles involved in unjustifiable homicides. Ultimately, this means that the rationale that the government should ban rifles like the AR-15 in order to save lives makes about as much sense as cutting off everyone’s hands and feet so we can’t strangle each other to death.
According to the US Congressional Research Office, there were approximately 110 million rifles in the United States in 2009. Assuming that number stayed the same (it probably grew) in 2012, that implies that 0.00024% of rifles are involved in unjustifiable homicides. In comparison, of the 312 million pairs of hands and feet in the United States, 667 were used in homicides. That implies that 0.00021% of pairs of hands/feet were used in unjustifiable homicides, a percentage insignificantly different from percent of rifles involved in unjustifiable homicides. Ultimately, this means that the rationale that the government should ban rifles like the AR-15 in order to save lives makes about as much sense as cutting off everyone’s hands and feet so we can’t strangle each other to death.
2.
Banning high capacity magazines doesn’t work.
Banning magazines over a certain size is a popularly
accepted gun control measure. The logic behind it is simple; if criminals have
less bullets to fire, than they will kill less people. The problem is that most
gun crime doesn’t even involve more than a few bullets being fired. According
to a study analyzing the effect of the 1994 “assault weapons” ban on gun
violence reported to the Department of Justice in 2004:
However, this information didn’t
stop the US government from banning magazines which held over 10 bullets
between 1994-2004. Despite this ban the DOJ report noted earlier found that:
“[C]riminal use of [large capacity
magazines] was rising or steady through at least the latter 1990s, based
on police recovery data… Post-2000 data... suggest that [large capacity
magazine] use may be dropping from peak levels of the late 1990s but provide no definitive evidence of a drop below pre-ban
levels.”
So the ban on high capacity
magazines didn’t stop or even cause a decline in their use, and even if it did,
most crimes don’t involve more than 4 shots being fired and thus wouldn’t be affected by the ban
anyway.
3. The
majority of gun deaths are voluntary
Gun control advocates cite often cite the statistic
that there are 30,000 gun deaths per year. While this is true, it is misleading
because the majority of those gun deaths are completely voluntary. In 2010, the
latest year for which data is available, the CDC documents
19,392 suicides by firearm. Additionally, the FBI reports
that there were 8,874 homicides
committed with firearms that same year. That means that 69% of firearm deaths
in 2010 were suicides. However, even with the 69% of gun deaths being
attributed to suicide, a few hundred more gun deaths are considered justifiable
(e.g self-defense). In 2010 there were 617 justifiable homicides using firearms
by police and private citizens.
This brings the true number of unjustifiable homicides committed with firearms
to 8,257.
However, many gun control
advocates will argue that restricting gun ownership is a good thing since it
could reduce the number of suicides. While it is true that gun ownership is positively correlated
with overall suicide rates in individual states in the US, a Harvard study
found that there is no correlation
between international suicide rates and firearm ownership. For example, Japan
has a suicide rate double that of the US despite having near zero gun
ownership.
Many things correlate with
suicide, that doesn’t mean that they cause it. Take for example a study which
found that the amount of country music radio stations play is strongly related to
the suicide rate, even when
controlling for other variables like gun availability and poverty. Should we
believe that country music causes people to off themselves? Maybe, or maybe
there is another unrecognized variable driving the relationship.
Regardless, if one believes the
government should restrict gun ownership to protect people from their own
choices, than stopping people from listening to country music, as well as
forcing people to have healthy diets would also seem like legitimate government
interventions into a person’s life. Such draconian and authoritative interventions
could not possibly be supported by any believer in human free will.
4: Fatal accidents with guns are nearly nonexistent.
A favorite argument for restricting gun ownership is
that having a gun in the home increases the risk of accidental death
dramatically. However, this is not the case. According to the Center for
Disease Control, 606
people died due to accidental discharge of firearms in 2010.
This is in comparison to 35,332 accidental deaths due to motor vehicles, 33,041
due to poisoning, 26,009 from accidental falls, 3,782 due to drowning, and
2,782 due to fire.
Cause of accidental death
|
Number of accidental deaths among
children (all ages)
|
Cut/ Pierce
|
105
|
Bicycle accidents
|
551
|
Firearm
|
606
|
Fire
|
2845
|
Suffocation
|
6,165
|
Drowning
|
3,782
|
Falling
|
26,009
|
Poisoning
|
33,041
|
Motor Vehicle
|
33,687
|
And if we look solely at children (age 14 and
below), it is clear from CDC data that accidental death by firearm is not a
statistically significant problem (see below).
Cause of accidental death
|
Number of accidental deaths among
children (Age 14 and below)
|
Cut/ Pierce
|
4
|
Bicycle accidents
|
58
|
Firearm
|
62
|
Falling
|
62
|
Poisoning
|
94
|
Fire
|
308
|
Drowning
|
726
|
Motor vehicle
|
1,418
|
While the media may scare people into thinking
firearm accidents are a major cause of accidental death among children, the
data shows that such accidents are extremely rare and comparable in number to
fatal bicycle accidents. For the public at large, firearm accidents are the
least of our worries. Accidental poisoning, drowning, falling, etc are far more
likely to occur.
It’s also worth noting that fatal accidents by
firearm have decreased 58% since 1991. It appears that this problem is one that
is taking care of itself.
Monday, April 7, 2014
Myth: Women earn less than men for the same work.
During his State of the Union Address, President
Obama stated “women make up about half our workforce. But they still make 77
cents for every dollar a man earns. That is wrong, and in 2014, it’s an
embarrassment.” Is it true that there is a gender wage gap? A better
question is: Do people who work different jobs, with different skills, and
different work hours earn different amounts of money? The answer is yes.
That 23% difference between what men get paid and
what women get paid is calculated by simply dividing the average earnings of
women by the average earnings of men. Thus, the 23%number is an apples to
oranges comparison that is so superficial that it is rendered meaningless. The
reality of the situation is that there are numerous variables which determine
how much a person is paid. Experience, education, where they work, how long they
work, if they are married, etc are all important factors yet the 23% number
completely ignores them.
There are many reasons why on average, men earn more
than women. Here are some:
-Men work more dangerous jobs. Dangerous jobs tend
to pay highly in order to attract people to take them. In 2009, the rate of
fatal occupational injuries per 100,000 full times workers was 5.5 for men and
0.6 for women [1].
-Men tend to work more in higher paying industries.
For example, engineering (any type) is one of the highest paying jobs in the
country. Not coincidentally, around 90% of engineers are males. On the other
hand, the least well-paying jobs in the US are those of social work, studio
arts, early childhood education, drama and theater, etc. And unsurprisingly,
women make of the majority of these workers. [2]
-Men tend to work longer hours. “[In 2009] Average hours for men were 41.3 per week, whereas
women worked 35.6 hours per week on average.” [3] Additionally, 44% of
full time workers are women compared to 56% which are men. [4]
-Part time workers tend to earn less, even among women. "The hourly pay of women who work part-time has been found to be 20 percent lower than the hourly pay of women who work full time, even when comparing women with the same levels of education and the same family circumstances such as being married, divorced, or with children" [8] Additionally, "Part time workers not only earn less total pay, they are also paid less per hour and are less likely to be promoted. There have, and continue to be, more women than men who are part-time workers" [8].
-Part time workers tend to earn less, even among women. "The hourly pay of women who work part-time has been found to be 20 percent lower than the hourly pay of women who work full time, even when comparing women with the same levels of education and the same family circumstances such as being married, divorced, or with children" [8] Additionally, "Part time workers not only earn less total pay, they are also paid less per hour and are less likely to be promoted. There have, and continue to be, more women than men who are part-time workers" [8].
-Many women take years out of the
labor force to bear children. This time out of the labor force seriously
diminishes the market value of their labor. Mothers tend to have lower wages
than childless women.[5]
-Marriage is also a significant
factor in determining wages. Studies have found that married men earn more money
(around 16% more) than non-married men even when controlling for factors like
education, age, number of hours worked, etc. [6] Research generally finds that marriage
has a negative or insignificant effect on women’s wages [5].
It is obvious that there are numerous factors which
have a hand in determining how much a worker is paid. A true, apples to apples
comparison would analyze the wage difference between men and women of the same
job with similar education, marriage status, skills, etc. Luckily, researchers
have done this. Here are the findings:
- “[A]mong workers who have never been married and
never had children, women earn 117% of what men do. (This factors in education,
hours worked and age.)” [7]
- “Among college educated, never married individuals
with no children who worked full time and were from 40-64 years old- that is,
beyond child bearing years-men averaged $40,000 a year in income, while women
averaged $47,000” [8]
-"This study
leads to the unambiguous conclusion that the differences in the compensation of
men and women are the result of a multitude of factors and that the raw wage
gap should not be used as the basis to justify corrective action. Indeed, there
may be nothing to correct. The differences in raw wages may be almost entirely
the result of the individual choices being made by both male and female
workers." [9]
The findings are clear, when
individuals of similar qualities are compared, the gender wage actually favors
women. Thus, the gender wage gap is undoubtedly a result of individual choices,
not gender discrimination. Anyone who cites the 23% gender wage number is
simply ignoring the fact that there are other determinants of worker’s wages
besides gender. And even then, there doesn’t appear to be any evidence that
gender even plays a role in how workers are compensated for their labor.
Parting thoughts: Intuitively we should
know that paying people less because of their gender is a downright terrible
idea. If women were equally as productive as men but paid less by their
employers, no one would hire men because it would be a complete waste of money
to pay more for the same amount of production. In reality, employers compete
for workers and value workers based on said worker’s productivity. If a company
can make profits by hiring women at higher wages than companies who
discriminate against them, they sure as hell are going to do that regardless of
their own prejudices. In a market economy, discrimination based on sex, race,
etc is punished. Any employer engaging in discrimination must accept the fact
that he will lose productive employees to his competitors or lose valuable customers
to competitors who don’t discriminate against people based on superficial
attributes like race, sex, etc. Either way, discrimination is a financially
unwise decision that most companies refuse to make.
Citations:
[4] Authors calculations based on this data: https://www.census.gov/newsroom/pdf/women_workforce_slides.pdf
[5] http://epc2014.princeton.edu/uploads/140782
[8] Sowell, Thomas. “Economic facts and fallacies”
[9] http://www.consad.com/content/reports/Gender%20Wage%20Gap%20Final%20Report.pdf
Myth: WWII brought the United States out of the Great Depression
This is a very popular belief and one which is
borne out by most measures of economic growth. And to be completely honest, as
the economy is conventionally measured, WWII did result in a rapidly expanding
economy. However, the reason why economic growth is important is because it
raises the standard of living of the lot of all men and women. This certainly
was not the case during the war. Instead of producing capital or consumer goods
that improved people's lives, the bulk of the economic growth during the war
came from government purchases which funded the manufacturing of tanks,
uniforms, bombs, bullets, etc. According to the economic historian Dr. Robert
Higgs:
"Yes,
national output as conventionally measured did grow hugely during the war...
[G]ross domestic product (in constant 1987 prices) increased by 84 percent
between 1940 and 1944. What the orthodox account neglects, however, is that
this "miracle of production" consisted entirely (and then some) of
increased government spending, nearly all of it for war materials and equipment
and military personnel. The private component of GDP (consumption plus
investment) actually fell after 1941, and while the war lasted,
private output never recovered to its pre-Pearl Harbor level. In 1943, real
private GDP was 14 percent lower than it had been in 1941. If a nation produces
an abundance of guns and ammunition, it does not thereby achieve genuine
prosperity .Those who lived through the war ... forget the scarcity of decent
housing, the hassles in commuting to work, and the severe rationing or complete
absence of basic consumer goods...Because of the many other ways that the
well-being of consumers deteriorated during the war, which the official data
fail to capture, actual wartime conditions were even worse than [the] figures
suggest." [1]
As Dr. Higgs notes, no
intellectually honest person would believe that the war was good for the
American people, nor the people in countries affected by the war. Indeed, the
American people suffered the rationing of basic goods and services as if they
lived in a communist command economy. Austrian economist Steve Horwitz and his
colleague Michael J. McPhillips published a study in 'The Independent Review'
which states:
"Whatever the war’s effects on
seemingly booming conventional macroeconomic aggregates, it entailed a
retrogression in the average American’s living standards, and that disconnect
should alert us to those aggregates’ limitations...The notion that World War II is responsible for ending the Great
Depression has met growing skepticism among economic historians. Although the
wartime economy saw increases in conventional measures of macroeconomic
performance, the letters, journals, and newspapers of the era indicate years of
continued material deprivation and hardship, rather than rising living
standards for the average American." [2]
Thus, while Gross Domestic Product
is a useful tool in measuring the size of the economy, any sort of production,
even if such production is socially harmful (like production of war materials
which crowds out private production) is considered a net gain.
Additionally, Economist Robert
Barro has done research on the multiplier effect of government spending during
WWII and concluded that the defense spending multiplier was 0.8 and the
non-defense spending multiplier was close to zero [3]. This suggests that while
government spending on defense stimulated production, it also crowded out
private sector investment. His results indicate that the "benefits"
of government spending did not outweigh the costs of crowded out private sector
investment. Thus, even by conventional measurement of the economy, WWII wasn't
exactly a net gain.
During the war, Keynesian
economists warned that an end to the excessive defense spending would lead to
an economic downturn. Leading Keynesian Alvin Hansen stated, "the government cannot just disband the Army, close
down munitions factories, stop building ships, and remove all economic
controls.” [4] Contra Hansen's advice, after the war the government "Government
canceled war contracts, and its spending fell from $84 billion in 1945 to under
$30 billion in 1946. By 1947, the government was paying back its
massive wartime debts by running a budget surplus of
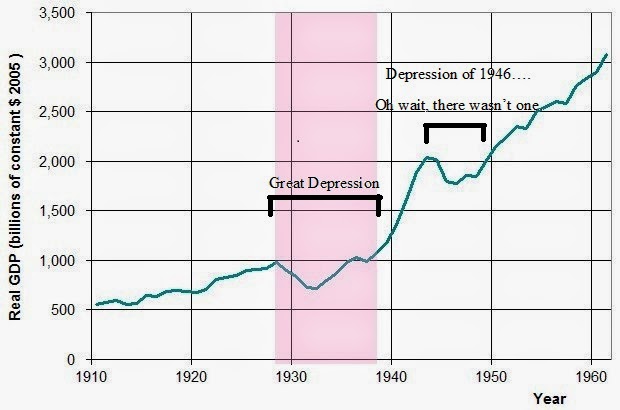
close to 6 percent of GDP"[4]. As a result conventional measurements of the macroeconomy (GDP), suggest that
there was a severe depression in 1946, the year after the war. However, this
economic downturn is almost never spoken of simply because it was a return to
normalcy from the economic sugar high of WWII. In fact, no one living during
the post-war years would think that they were living in a depression. There was
no evidence of diminished consumption after the war and the unemployment rate
was 3.9% in 1946, indicating a strong economy. Of course, this unemployment
rate was higher than the 1.2% unemployment rate of 1944 because millions of
soldiers who volunteered or were drafted into the military returned home [5].
As historian Thomas Woods has suggested, the miracle of employment during the
war could easily be achieved at any time if the government decided to simply
kill off the unemployed, but that is both perverse and insane [6]. Woods'
comments are meant to highlight the fact that low unemployment due to mass
military conscription is nothing to be proud of.
After the war, the US economy shrank from
decreased production of war materials, however, after the initial
"depression" the economy (especially the private sector) expanded
rapidly, creating a post war economic boom which continues to be studied today.
In the end, we should be wary of the claim that WWII ended the Depression
simply because producing an abundance of weaponry for war does
nothing to further the standard of living for the lot of all men and women.
Socially useful production is determined subjectively by individuals engaging
in voluntary exchange en mass, government allocation of resources may grow the
economy by conventional macroeconomic measurements, but if no one values what
is produced than that production was a waste of scarce resources. And that is
exactly what World War II was, a necessary waste of scarce resources and human
life, nothing more. Hopefully the world will never have to experience such a
"miracle of production" again.
Citations:
[1] http://www.independent.org/newsroom/article.asp?id=2188
[2] http://www.independent.org/publications/tir/article.asp?a=915
[3] http://online.wsj.com/news/articles/SB123258618204604599
[4] http://www.cato.org/policy-report/mayjune-2010/stimulus-spending-cuts-lessons-1946
[5] http://mises.org/journals/rae/pdf/rae5_2_1.pdf
[6] https://www.youtube.com/watch?v=71tPBjrTeJU
Subscribe to:
Posts (Atom)